The OECD has launched a new database providing detailed and comparable tax revenue information for 80 countries around the world – and which will expand to cover more than 90 countries by the end of 2018.
The Global Revenue Statistics Database provides what it says is the largest public source of comparable tax revenue data on tax levels (% of GDP) and structures (income tax / VAT or GST, etc.).
- It will support efforts to raise domestic revenues for sustainable development.
- It will strengthen the capacity of governments and tax policy-makers to develop and implement tax policy reforms that will raise domestic resources to fund the provision of vital public goods and services.
A working paper, drawing on the new database, shows that countries have made strong progress towards mobilising domestic financing for development. The OECD says levels of tax revenues are now higher and more even across countries than at the turn of the century; and countries with the lowest revenues have experienced the largest increases in their tax-to-GDP ratios.
The Global Revenue Statistics Database integrates information from the four annual Revenue Statistics publications, which provide tailored insights on tax systems and revenue priorities in African, Asian, Latin American and Caribbean (LAC), and OECD countries. Based on the internationally-recognised OECD standard, the publications are produced in partnership with regional partners, with the financial support of the European Union, and in close collaboration with participating countries.
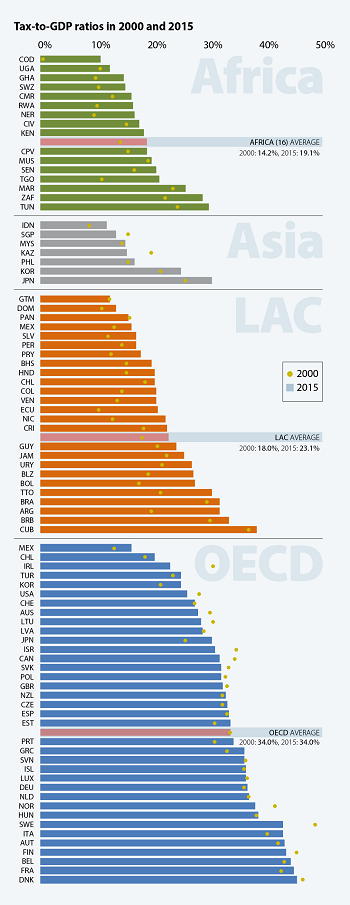
Key findings from the working paper (drawing from the new database) are set out below and graphically depicted below:
- Across the 80 countries, tax-to-GDP ratios range from 10.8% to 45.9%.
- Half of the countries have a tax-to-GDP ratio ranging between 18.2% and 33.2% of GDP.
- The median tax-to-GDP ratio is 26.2%.
- Since 2000, three-quarters of the countries in the database have increased their tax to GDP ratios:
- Half of the countries have increased their tax-to-GDP ratios by between 0 and 5% of GDP;
- A further quarter have increased their tax-to-GDP ratio by more than 5% of GDP. Most of these countries are from Africa and LAC.
- The remaining quarter of countries, where tax-to-GDP ratios fell, are predominantly OECD countries.
- In Africa (16) and LAC, taxes on goods and services (especially VAT) and corporate income taxes are particularly important as a share of revenues. Social security contributions and personal income taxes form the highest shares of tax revenue in most OECD countries, with VAT playing a smaller role.
- Since 2000, VAT has become increasingly significant in more than three-quarters of the countries, in many cases, with corresponding falls in the share of income taxation or taxes on other goods and services. The exceptions are the quarter of countries with the highest increases in their tax to GDP ratios, which recorded strong increases in most or all major tax types.
- Per capita income, and different types of tax structures, are linked to the level of taxation.
- There is a positive correlation between tax-to-GDP levels, per-capita income levels and the share of personal income tax and social security contributions.
- There is a negative correlation between tax-to-GDP levels and the shares of corporate taxes and taxes on goods and services.
FJM 14.7.18
[OECD website: Media Release; LTN 126, 4/7/18; Tax Month – July 2018]
Comprehension questions (answers available)
- Does the data base measure tax levels as a % of GDP?
- Is the 2015 average tax, to GDP percentage: 19.1% for African countries; 23.1% for Latin American countries; and 34.0% for OECD countries [hint, you’ll need to look at the graphs below]?
- Since 2000, have most countries decreased their total tax to GDP percentage?
- Are examples of countries, whose total tax to GDP percentage dropped (since 2000): Ireland, Israel and Sweden?
- Relatively speaking, are they all high taxing countries?
- Is there a positive correlation between the share of income tax and overall tax levels?
- Is there a negative correlation between goods and services taxes and overall tax levels?