

Why we measure the tax gap
Estimating tax gaps forms part of the ATO’s broader accountability and transparency as a leading administrator. It is consistent with contemporary international best practice in tax administration.
Australians all benefit from healthy tax and superannuation systems that support our society and economy. The community expects us to manage all aspects of the systems, including advising on the tax gaps and what we are doing about them. As such, we measure and publish tax gaps, where they are credible and reliable, to inject our perspective into the community debate.
Tax gap estimates are also important for us to better understand levels of compliance and risk in the tax and superannuation systems, to inform our resource allocation, and to assess the effectiveness of our work over time.
Tax gaps are an indication of the system in operation. The insights gained from this analysis guide us in determining priority risks and development of strategies, including administrative design, help and education, and audit strategies.
Tax gaps internationally
Other administrations also measure tax gaps, including:
- Her Majesty’s Revenue and Customs (HMRC) – United Kingdom
- Internal Revenue Service (IRS) – United States
- Danish Customs and Tax Administration (SKAT)
- Canada Revenue Agency.
The European Commission (EU) uses external researchers to identify the value-added tax (VAT) gap in each of its 28 member countries, providing trends over time. The International Monetary Fund (IMF) provides support to jurisdictions in estimating tax gaps.
The ATO gap measurement methodologies draw on the experience of the above contemporary administrations to ensure our estimations meet best practice. We also share our tax gap information with our counterparts in HMRC and the IRS.
Engagement, advice and assurance
In developing our estimates, we engage key stakeholders and subject matter experts within the ATO and the community, including tax gap experts, researchers, academics, government agencies and taxpayer representative groups.
Work with our broad range of advisors and stakeholders, on refining our methodologies and developing approaches to estimating other tax gaps, is ongoing.
Independent expert panel
Recognising the importance of having reliable and credible tax gaps, we engage an independent expert panel to provide advice on the suitability of our gap estimates and methodologies. The panel was established in 2013.
The panel’s advice considers:
- whether proposed methodologies can be relied on to produce a sufficiently robust gap estimate
- whether the methodologies are likely to be broadly accepted as a way of estimating a gap and whether alternative methodologies should be considered
- international comparability, including global developments in the use of tax gap estimation methodologies and practices.
The panel currently comprises:
- Neil Warren – Professor of Taxation, School of Taxation and Business Law, University of New South Wales. Neil is a respected economist, specialising in public sector economics with a special focus on taxation policy and fiscal federalism. Neil has received several grants, organised numerous conferences and consulted widely, preparing reports for state and federal government agencies. He has provided expert opinion to government inquiries and parliamentary committees, and advice to political parties and welfare and industry groups. Neil has been a member of the panel since 2013.
- Richard Highfield – a highly experienced tax professional having worked within the fiscal areas of the International Monetary Fund (IMF) and the Organisation for Economic Co-operation and Development (OECD). Richard has a wealth of experience in both domestic and international taxation. He is an adjunct professor with the School of Taxation and Business Law, University of New South Wales, and has been a member of the panel since 2013.
- Saul Eslake – an independent economist, and vice-chancellor’s fellow at the University of Tasmania. Saul has decades of experience in the Australian financial markets, and has been previously employed as Chief Economist at ANZ, Bank of America Merrill Lynch, and National Mutual Funds Management. Saul joined the panel in 2017, following the stepping down of Chris Richardson.
- Chris Richardson – a partner at Deloitte Access Economics – was a member of the panel from its inception in 2013. Chris is in charge of the forecasting and policy unit. He is a well-known economist and a commentator and presenter on economic trends in both broadcast and print media. Chris stepped down from the panel in April 2017.
We look to the expert panel to review our detailed methodology and provide independent assessment on it, and on the reliability rating for each of our tax gap estimates. Reliability ratings provide a transparent assessment of our gap estimates (see How we measure tax gaps).
How we measure tax gaps
Our estimates aim to quantify the level of non-compliance across the four pillars of compliance – registration, lodgment, reporting and payment obligations. Where possible, we also estimate the amount of revenue not collected from those who do not register or lodge. Penalties and interest are not included in gap estimates.
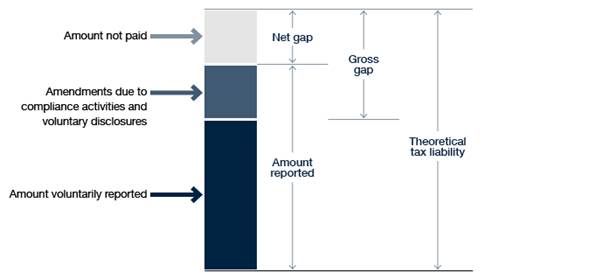
We have two measures of the gap:
- The gross gap, which is the difference between
- the amount voluntarily reported to us
- the amount that would have been collected if every taxpayer was fully compliant (that is, theoretical tax liability).
- The net gap, which is the difference between
- the total amount reported (the amount voluntarily reported to us, plus amendments as a result of compliance activities and voluntary disclosures)
- the amount that would have been collected if every taxpayer was fully compliant.
Tax gap concepts
We estimate gaps for the year the economic activity occurred. They are historical and based on the law and the administrative approaches at the time they are calculated.
Methodological approaches
We use a combination of methods to estimate tax gaps and assess their reliability:
- Top-down estimates are developed using externally-sourced aggregated data, for example, Australian Bureau of Statistics (ABS) data.
- Bottom-up estimates involve analysing internal data sources, such as tax returns or audit data, and extrapolating the results to determine the extent of non-compliance across the whole population.
The table below shows the approach we currently use for each tax gap estimate.
| Gap estimate | Methodological approach |
|---|---|
| Fuel excise | Top down |
| Fuel tax credits (FTC) | Bottom up |
| Goods and services tax (GST) | Top down |
| Large corporate groups income tax | Bottom up – illustrative |
| Pay as you go (PAYG) withholding | Top down |
| Superannuation guarantee | Top down |
| Wine equalisation tax (WET) | REP and top down |
See also:
Reliability assessment
All gap estimates are assessed for reliability against a set of standard criteria. We summarise these in a reliability assessment for each gap estimate.
The table below reflects the reliability ratings for our current gap analysis, as assessed by our independent expert panel.
| Gap estimate | Reliability |
|---|---|
| Fuel excise | Medium |
| Fuel tax credits (FTC) | Medium |
| Goods and services tax (GST) | Medium |
| Large corporate groups income tax | Medium |
| PAYG withholding | Medium |
| Superannuation guarantee | Medium |
| Wine equalisation tax (WET) | Medium |
Addressing the gap
Our focus on prevention (before correction) influences the gross tax gap and drives it down. To focus just on correction would influence the net gap only.
We take this into consideration as we continue to refine and develop the range of strategies we employ to manage tax gaps.
Our primary strategy is to make it as easy as possible for Australians to comply with their tax obligations. We look at this from many perspectives:
- enhancing our digital services
- improving our processes and technology, including our data-matching capability
- providing advice to government, via Treasury, where we see law reform options
- working with partner agencies and stakeholders to improve the tax and superannuation systems
- providing guidance and advice to clarify areas of uncertainty, including issuing Taxpayer Alerts if we see potential risks
- dealing with non-compliance, including investigating aggressive tax planning.
Tax gap research program
The diagram below shows the various tax gaps that form our overall gap research program, within the context of the Australian tax and superannuation systems.
The gaps are grouped into three programs of analysis:
- transaction-based tax gaps – for taxes collected and paid by an entity higher up in the supply chain (with the cost generally borne by the consumer), such as goods and services tax (GST) and fuel excises
- income-based tax gaps – income tax (for both individuals and businesses), large and small super funds, and fringe benefits tax gaps
- administrative gaps – non-tax gaps, including for pay as you go (PAYG) withholding, superannuation guarantee and other administered programs.
The relationship between the various gaps is complex. While some are mutually exclusive, some are closely related or form subsets within the established gap estimates. For example:
- work-related expenses, levies, rebates and concessions are subsets of the income-based tax gaps for small business and individuals
- some gaps arise through employment – employment-related gaps includes PAYG withholding, superannuation guarantee and fringe benefits tax (for individuals).
In addition, the ‘black economy’ manifests in a number of gap estimates. For example, unreported income is included in individuals (non-business), small business, PAYG withholding and superannuation guarantee. The black economy affects these gaps to varying degrees.
These complexities demonstrate why the gap estimates cannot be aggregated into one figure.
Tax gap research program overview

How to use the estimates
The tax gap estimates should be viewed as trends over time, in conjunction with our performance measures. The dollar value is indicative rather than definitive.
All estimates have a margin of error, which may not be quantifiable. The estimates are subject to limitations and caveats that need to be considered when using them and drawing conclusions. These limitations are explained in Principles and approaches to measuring gaps.
Gap estimates should not be aggregated into one figure or divided by annual ATO collections, or other aggregated revenue amounts.
Summary findings
In October 2017, we updated our estimates for goods and services tax (GST), wine equalisation tax (WET), fuel excise, pay as you go (PAYG) withholding, and fuel tax credits (FTC). We are in the process of refreshing our estimates and anticipate the next updates will be published in October 2018.
We have also added two new gaps: superannuation guarantee and large corporate groups income tax.
We are working towards developing tax gap estimates for all of the taxes and programs we administer.
The following is a summary of our latest gap estimates in alphabetical order (note that the latest data varies depending on the particular gap):
- Fuel excise gap – the net fuel excise gap is estimated to be $325 million (1.9%) in 2015–16. The excise products covered in this estimation are concentrated in an industry with a small number of large taxpayers who we have generally observed to be highly compliant.
- Fuel tax credits – the net fuel tax credits gap for 2015–16 is estimated to be –$19 million (−0.3%). This reflects our findings from random enquiries that suggest the under-claiming of fuel tax credits exceeds the over-claimed amounts. This result is consistent with previous estimate outcomes.
- GST gap – the net GST gap estimate for 2015–16 has trended slightly upwards from previous years to $4.5 billion (7.3%). This rise reflects a stronger growth of the theoretical GST liability estimate relative to actual GST collections. It is the highest gap among the taxes we have analysed to date, but compliance levels are quite stable. Australia ranks relatively well among similar nations that have estimated GST/VAT gaps.
- Large corporate income tax gap – in 2014–15, the net large corporate income tax gap is estimated to be $2.5 billion (5.8%). This trend has been steady for a number of years, and the gap primarily reflects differences in the interpretation of complex areas of tax law.
- PAYG withholding gap – the net PAYG withholding gap estimate for 2014–15 is $3.1 billion (1.9%). This suggests that employers are generally compliant with their withholding obligations. We estimate that employers are paying about 95% of the PAYG withholding they are required to without intervention from us.
- Super guarantee gap – for 2014–15, we estimate the super guarantee gap to be $2.85 billion. This represents 5.2% of the total estimated $54.78 billion in super guarantee employers were required to pay. In 2014–15, superannuation funds reported to the ATO that employers paid $51.51 billion in super guarantee. This represents 95% of our adjusted theoretical super guarantee amount.
- Wine equalisation tax gap – in the 2014–15 WET estimate, we included the payable and refundable WET amounts to generate a net WET gap estimate. A new methodology was adopted that used a random enquiry program. The net WET gap estimate for 2014–15 is $4.7 million (0.6%). This is consistent with our observations of compliance within the WET system.
Our latest net gap estimates (both as a dollar value and percentage) are shown in the tables below. The tax reported and reliability assessment of each estimate are also shown.
| Tax gap estimate | Reliability assessment | Financial year | Amount reported ($m) | Net gap ($m) | Net gap (%)(d) |
|---|---|---|---|---|---|
| Fuel excise | Medium | 2015–16 |
16,891 |
326 |
1.9 |
| Goods and services tax | Medium | 2015–16 |
57,627 |
4,508 |
7.3 |
| Large corporate groups income tax | Medium | 2014–15 |
40,728 |
2,526 |
5.8 |
| Wine equalisation tax(e) | Medium | 2014–15 |
819 |
4.7 |
0.6 |
(a) We are in the process of refreshing our estimates and anticipate the updates will be published in October 2018.
(b) All figures are rounded to the nearest $1 million.
(c) Changes from previously published estimates are due to revisions to ABS data, updated ATO data and a modified approach to determining liabilities reported but not paid. The beer excise and duty gap estimate has been withdrawn due to identified issues with data.
(d) Net gap percentage is calculated as net gap divided by estimated total tax with full compliance (that is, tax reported plus the gap).
(e) For 2013–14 and prior years, the estimate is for WET payable only, not taking into account wine producer rebates.
| Tax gap estimate | Reliability assessment | Financial year | Amount reported ($m) | Net gap ($m) | Net gap (%)(d) |
|---|---|---|---|---|---|
| Fuel tax credits | Medium | 2015–16 |
6,089 |
−19 |
−0.3 |
| PAYG withholding(e) | Medium | 2014–15 |
165,511 |
3,130 |
1.9 |
| Superannuation guarantee | Medium | 2014–15 |
51,514 |
2,854 |
5.2 |
(a) We are in the process of refreshing our estimates and anticipate the updates will be published in October 2018.
(b) All figures are rounded to the nearest $1 million.
(c) Changes from previously published estimates are due to revisions to ABS data, updated ATO data and a modified approach to determining liabilities reported but not paid.
(d) Net gap percentage is calculated as net gap divided by estimated total tax with full compliance (that is, tax reported plus the gap).
(e) The latest available year for the PAYG withholding gap estimate is 2014–15.